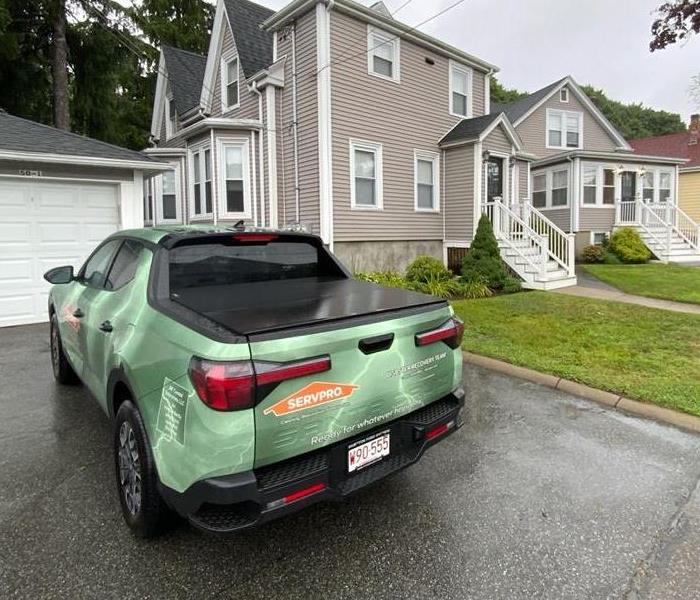
August in Massachusetts: How SERVPRO Handles Common Residential Restoration Challenges
8/20/2024 (Permalink)
 Residents experience the peak of summer's heat along with the potential for severe weather.
As August unfolds in Massachusetts, residents experience the peak of summer's heat along with the potential for severe weather. This time of year can bring its own set of residential restoration challenges. From dealing with storm damage to handling excess humidity, SERVPRO® is here to guide you through the specific issues you might face and ensure your home remains safe and comfortable.
1. Storm Damage: Massachusetts Summer Showers
August in Massachusetts can bring unpredictable weather, including heavy thunderstorms and occasional hurricanes. These storms can lead to significant damage, such as:
- Roof Leaks and Wind Damage: High winds and heavy rains can cause roof damage and water leaks. SERVPRO is equipped to handle emergency board-up services, roof tarp installation, and comprehensive repairs to safeguard your home.
- Flooding: Flash floods are a risk during intense summer storms. Our team provides prompt water extraction and drying services to mitigate damage and prevent mold growth.
2. Air Conditioning Issues: Staying Cool and Dry
With temperatures rising, air conditioning units are working hard to keep your home cool. This increased use can sometimes lead to:
- Condensation Problems: Air conditioners can produce excess moisture. If the drainage system is clogged or malfunctioning, it can cause water damage to ceilings or walls. SERVPRO addresses these issues by inspecting and repairing HVAC systems, ensuring proper drainage and preventing leaks.
- System Failures: Malfunctions or overuse of AC units can lead to water leaks. We provide thorough inspections and repair services to keep your system running smoothly.
3. Humidity and Mold Growth: A Summer Concern
The high humidity levels in Massachusetts during August create a perfect environment for mold growth. Mold can develop in hidden areas, making early detection essential:
- Mold Inspections: We use advanced technology to locate and assess mold growth. Our thorough inspections help us find mold in concealed spaces like attics and basements.
- Mold Remediation: SERVPRO’s certified mold remediation specialists handle the removal and treatment of mold, ensuring that your home is restored to a safe and healthy condition.
4. End-of-Summer Maintenance: Preparing for Fall
August is an ideal time to prepare your home for the transition into fall and address any lingering summer issues:
- Gutter Cleaning: Clearing gutters of debris is crucial to prevent water damage and ensure proper drainage. SERVPRO offers professional gutter cleaning services to help maintain your home’s exterior.
- Attic and Basement Checks: Inspect these areas for moisture or damage. Early detection of problems can prevent more significant issues as the weather changes.
5. Emergency Preparedness: August and Beyond
Ensuring your home is prepared for emergencies is always important:
- Update Emergency Kits: Review and update your emergency kits to include essential items like first-aid supplies, flashlights, and non-perishable food.
- Review Safety Measures: Test smoke detectors and carbon monoxide detectors, and check for any other potential hazards in your home.
6. Seasonal Tips for Massachusetts Homeowners
Taking a proactive approach can help you avoid future problems:
- Inspect Roof and Siding: Regularly check for signs of wear or damage to prevent leaks and maintain your home’s structural integrity.
- Check for Leaks: Regularly inspect your home for leaks, especially in areas prone to moisture accumulation, to address issues before they escalate.
Conclusion
August in Massachusetts presents unique residential restoration challenges, from storm damage to managing high humidity and air conditioning issues. SERVPRO is here to help you tackle these challenges with expertise and efficiency. Whether you’re dealing with water damage, preparing your home for the fall season, or addressing mold concerns, our team is dedicated to providing top-notch restoration services. Contact SERVPRO today to ensure your home remains in excellent condition throughout the summer and beyond.
Discover SERVPRO's State-of-the-Art Conference Room
7/8/2024 (Permalink)
 Make your next event a success with SERVPRO's conference room.
Welcome to the SERVPRO® conference room, where innovation meets functionality for your educational and networking needs. Whether you're hosting a workshop, seminar, or industry event, our facility is designed to enhance your experience and exceed your expectations.
Key Features
Located in Salem, MA, our conference room offers:
- Nearly 1500 square feet of versatile space, accommodating up to 60 attendees comfortably.
- Two large screens for dynamic presentations and detailed demonstrations.
- Flexible seating arrangements tailored to suit different event types and preferences.
- A conducive environment that promotes engagement and focus.
Ideal for Your Industry
Our conference room caters specifically to professionals such as:
- Restoration Workers: Stay informed with the latest industry standards and techniques.
- Insurance Adjusters: Enhance your knowledge base with valuable continuing education opportunities.
- Realtors: Utilize our space for networking mixers and client presentations.
- Other Professionals: Perfect for hosting industry meetups and collaborative events.
Technology and Amenities
Equipped with advanced technology to support your needs:
- High-speed Wi-Fi ensures seamless connectivity throughout your event.
- State-of-the-art AV equipment for clear, impactful presentations.
- Interactive tools including whiteboards and flip charts for collaborative learning sessions.
- Complimentary refreshments and optional catering services available to keep your attendees refreshed and focused.
Convenient Location
Situated for accessibility and convenience:
- Ample on-site parking ensures hassle-free arrivals for all participants.
- Close proximity to local hotels, restaurants, and attractions facilitates ease of travel and accommodation.
Reserve Your Event Today
Make your next event a success with SERVPRO's conference room. Contact us now to secure your preferred dates and discuss your event requirements. Visit our website for more detailed information and to conveniently book online.
Contact Information:
- Phone: 978 744 4545
- Email: theenan@SERVPROsalem.com
Don't miss out on the opportunity to elevate your professional gatherings. Experience excellence at SERVPRO's state-of-the-art conference room. We look forward to hosting you!
Why Summertime is Prime Time for Mold Growth?
6/24/2024 (Permalink)
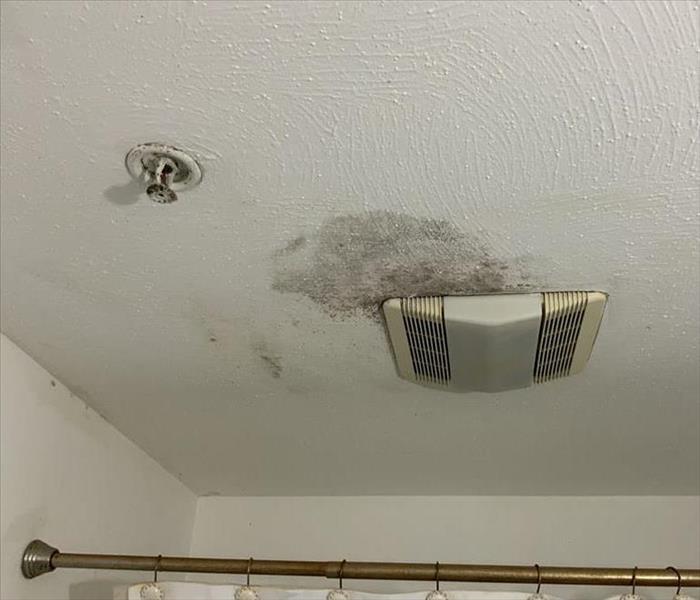 If mold does become a problem, contacting a professional mold remediation service like SERVPRO® can help ensure thorough cleanup and restoration..
As the temperatures rise and humidity levels soar during the summer months, homeowners may find themselves facing an unexpected challenge: mold growth. Mold thrives in warm, humid environments, making summertime the perfect breeding ground for its proliferation. Here’s why:
1. High Humidity Levels: During summer, humidity levels tend to be higher both indoors and outdoors. Excess moisture in the air can accumulate indoors, especially in poorly ventilated areas such as basements, bathrooms, and attics. This moisture creates an ideal environment for mold spores to settle and grow.
2. Condensation Issues: Air conditioning units and cool surfaces indoors can lead to condensation when warm, humid air comes into contact with these cooler surfaces. This condensation can promote mold growth on walls, ceilings, and even furniture if not properly managed.
3. Outdoor Mold Spores: Summer is when many outdoor molds release their spores into the air. These spores can easily find their way indoors through open windows, doors, and ventilation systems. Once inside, they can settle on surfaces and begin to grow if conditions are right.
4. Poor Ventilation: In an effort to keep cool, homes are often sealed tightly with windows and doors closed. This lack of ventilation can trap moisture indoors, exacerbating humidity levels and creating stagnant air—both of which are conducive to mold growth.
5. Neglected Maintenance: Summer vacations and busy schedules may lead to neglected maintenance tasks such as cleaning gutters, checking for leaks, or repairing roof damage—all of which can contribute to moisture buildup and mold issues if left unaddressed.
Preventing Summertime Mold Issues:
While mold growth can be a concern during the summer, there are proactive steps homeowners can take to mitigate its impact:
- Monitor Humidity Levels: Invest in a humidity monitor and keep indoor humidity levels below 60%.
- Use Dehumidifiers: Especially in high-moisture areas like basements, use dehumidifiers to reduce humidity levels.
- Improve Ventilation: Open windows and doors when weather permits, and use exhaust fans in bathrooms and kitchens to improve airflow.
- Inspect and Maintain: Regularly inspect your home for leaks, especially around windows, doors, and roofs. Repair any issues promptly to prevent moisture intrusion.
- Clean Regularly: Regular cleaning and dusting can help remove mold spores before they settle and grow.
- Control Outdoor Vegetation: Keep plants and shrubs trimmed away from the house to improve airflow and reduce moisture buildup.
Conclusion:
While summertime brings sunshine and warmth, it also brings increased humidity levels that can lead to mold growth if not properly managed. By staying vigilant, monitoring humidity levels, and taking preventive measures, homeowners can enjoy a mold-free summer and maintain a healthy indoor environment for their families. If mold does become a problem, contacting a professional mold remediation service like SERVPRO® can help ensure thorough cleanup and restoration. Stay informed and proactive to keep your home safe and mold-free throughout the summer season.
Build An Emergency Supply Kit
9/19/2016 (Permalink)
Build An Emergency Supply Kit
September is National Preparedness Month and provides the perfect opportunity to review your emergency plan. Emergencies can happen unexpectedly in communities just like yours, to people just like you. Tornado outbreaks, river floods, flash floods, historic earthquakes, and even water main breaks and power outages in U.S. cities affecting millions of people for days at a time.
Now is the time to think about the basics, things you will need in advance of an emergency; how you will communicate, what supplies you will need to keep in your home, car or office. Use the list provided here to build an emergency supply kit to ensure your family is equipped and ready for a any type of disaster.
- Water, gallon per person per day
- Food, non-perishable 3-day supply
- Manual can opener
- Battery operated radio and extra batteries
- Flashlight and extra batteries
- First aid kit
- Whistle to signal for help
- Clothing
- Dust masks or bandanas
- Plastic sheeting, garbage bags and duct tape
- Wrench or pliers to turn off utilities, if necessary
- Local maps
- Hygiene items
- Important documents such as copies of insurance policies, identification and bank account information
- Cash
- Fire extinguisher
- Matches in waterproof container
SERVPRO® of Salem, Peabody, Marblehead
978-744-4545
We are always here to help.
Labor Day September 5, 2016
9/1/2016 (Permalink)
LABOR DAY MONDAY, SEPTEMBER 5, 2016
The following information is from The U.S. Department of Commerce:
Labor Day 2016: Sept. 5
The first observance of Labor Day was likely on Sept. 5, 1882, when some 10,000 workers assembled in New York City for a parade. The parade inspired similar events across the country, and by 1894 more than half the states were observing a “workingmen’s holiday” on one day or another. Later that year, with Congress passing legislation and President Grover Cleveland signing the bill on June 29, the first Monday in September was designated “Labor Day.” This national holiday is a creation of the labor movement in the late 19th century and pays tribute to the social and economic achievements of American workers.
--------------------------------------------------------------------------------
Who Are We Celebrating?
158.5 million
The number of people age 16 and over in the nation’s labor force as of May 2016.
Source: U.S. Bureau of Labor Statistics
--------------------------------------------------------------------------------
Our Jobs
Largest Occupations May 2015 Number of employees
Retail salespeople 4,612,510
Cashiers 3,478,420
Combined food preparation and
serving workers, including fast food 3,216,460
Office clerks, general 2,944,420
Registered nurses 2,745,910
Customer service representatives 2,595,990
Waiters and waitresses 2,505,630
Laborers and freight, stock and
material movers, hand 2,487,680
Secretaries and administrative
assistants, except legal,
medical and executive 2,281,120
Janitors and cleaners,
except maids and housekeeping
cleaners 2,146,880
Source: U.S. Bureau of Labor Statistics, Occupations with the Highest Employment, May 2015
--------------------------------------------------------------------------------
16.4 million
The number of wage and salary workers age 16 and over represented by a union in 2015. This group included both union members (14.8 million) and workers who reported no union affiliation but whose jobs were covered by a union contract (1.6 million).
Among states, New York continued to have the highest union membership rate (24.7 percent), and South Carolina had the lowest rate (2.1 percent).
Source: U.S. Bureau of Labor Statistics
--------------------------------------------------------------------------------
15.2 million
The number of employed female workers age 16 and over in service occupations in 2014. Among male workers age 16 and over, 11.8 million were employed in service-related occupations.
Source: U.S. Census Bureau, 2014 American Community Survey, Table C24010
--------------------------------------------------------------------------------
1.9%
The percentage increase in employment, or 141.9 million, in the U.S. between December 2014 and December 2015. In December 2015, the 342 U.S. counties with 75,000 or more jobs accounted for 72.5 percent of total U.S. employment and 77.8 percent of total wages. These 342 counties had a net job growth of 2.2 million over the year, which accounted for 81.4 percent of the overall U.S. employment increase.
Source: U.S. Bureau of Labor Statistics
--------------------------------------------------------------------------------
Another Day, Another Dollar
$50,383 and $39,621
The 2014 real median earnings for male and female full-time, year-round workers, respectively. The 2014 real median household income of $53,657 is not statistically different in real terms from the 2013 median of $54,462.
Source: U.S. Census Bureau, Income and Poverty in the United States: 2014
--------------------------------------------------------------------------------
$74,297
The 2014 median Asian household income, the highest among race groups. The median income of non-Hispanic, white households was $60,256 and for black households it was $35,398. For Hispanic households the median income was $42,491.
Source: U.S. Census Bureau, Income and Poverty in the United States: 2014
--------------------------------------------------------------------------------
Fastest Growing Jobs
108.0%
The projected percentage growth from 2014 to 2024 in the number of wind turbine service technicians (4,400 jobs in 2014), the projected fastest-growing occupation. Meanwhile, the occupation expected to add the greatest number of positions over this period is personal care aides (458,100).
Source: U.S. Bureau of Labor Statistics
--------------------------------------------------------------------------------
Employee Benefits
88.8%
The percentage of full-time, year-round workers age 18 to 64 covered by health insurance during all or part of 2014.
Source: U.S. Census Bureau, Health Insurance Coverage in the United States
--------------------------------------------------------------------------------
Say Goodbye to Summer
Labor Day is celebrated by most Americans as the symbolic end of the summer and the start of the back-to-school season.
25,214
The number of shoe stores for back-to-school shopping in 2014. Also catering to back-to-school needs were 28,138 family clothing stores; 7,898 department stores; 7,351 children and infants’ clothing stores; 6,823 office supply and stationery stores; and 6,888 book stores.
Source: U.S. Census Bureau, 2014 County Business Patterns
21,830
The number of sporting goods stores nationwide in 2014. Examples of these types of stores include athletic uniform supply, fishing supply and exercise equipment, as well as bicycle and golf pro shops. In U.S. sports, college football teams usually play their first games the week before Labor Day, with the NFL traditionally playing its first game the Thursday following Labor Day.
Source: U.S. Census Bureau, 2014 County Business Patterns, NAICS 451110
53,306
The number of travel agents employed full time, year-round in the U.S. in 2014. In addition, there were 15,875 tour and travel guides employed full time, year-round nationwide. On a weekend intended to give U.S. workers a day of rest, many people climb into their drivers’ seats or board an airplane for a quick end of the summer getaway.
Source: U.S. Census Bureau,
904,084
The number of paid employees (for the pay period including March 12) who worked for a gasoline station in the U.S. in 2014. Oregon (10,629 paid gasoline station employees) and New Jersey (17,411 paid gasoline station employees) are the only states without self-service gasoline stations. Oregon was the first state to make Labor Day a holiday in February 1887.
Source: U.S. Census Bureau
--------------------------------------------------------------------------------
The Commute to Work
6.3 million
The number of commuters who left for work between midnight and 4:59 a.m. in 2014. They represented 4.5 percent of all commuters. The most common time was between 7 a.m. and 7:29 a.m. – with 20.6 million commuters.
Source: U.S. Census Bureau
4.5%
The percentage of workers age 16 and over who worked at home in 2014.
Source: U.S. Census Bureau
76.5%
The percentage of workers age 16 and over who drove alone to work in 2015. Another 9.2 percent carpooled and 0.6 percent biked to work.
Source: U.S. Census Bureau
26.0 minutes
The average time it took workers in the U.S. to commute to work in 2014. New York (32.6 minutes) and Maryland (32.3 minutes) had the most time-consuming commutes.
Source: U.S. Census Bureau
--------------------------------------------------------------------------------
Editor’s note: The preceding data were collected from a variety of sources and may be subject to sampling variability and other sources of error. Facts for Features are customarily released about two months before an observance in order to accommodate magazine production timelines. Questions or comments should be directed to the Census Bureau’s Public Information Office.


 24/7 Emergency Service